Personalized Customer Satisfaction Survey Helps Piggly Wiggly NC Boost the Customer Experience
Personalized Customer Satisfaction Survey Helps Piggly Wiggly NC Boost the Customer Experience
Independent grocery retailer relies on customer data to successfully improve an underachieving store’s performance
Independent grocery chains have it hard these days. Their biggest problem used to be the big supermarket chains, but now they’re facing competition from all sides. Amazon and meal delivery services assault the stores from online; big-box businesses like Walmart and Target entice shoppers with convenience and low prices; and niche grocers like Whole Foods, Trader Joe’s, and ALDI siphon off yet more customers. Not to mention, consumers can buy drinks, candy, paper towels, and other grocery items almost everywhere they turn, from gas stations to office stores. Grocery stores already operate on a razor-thin profit margin of 1% to 3%, and all this competition puts even more pressure on the independents.
Piggly Wiggly, a supermarket chain with over 600 independently owned stores in 17 Southern and Midwestern states, has always been about innovating. Its original location, in Memphis, was the first self-service supermarket; before this, customers would place their orders with a store clerk, who would gather the items.
Piggly Wiggly also was the first store to provide checkout stands, price mark items individually, offer shopping carts, and use refrigerated cases for produce.
James Messer, president of Piggly Wiggly NC, knows groceries. He’s been in the business since he started bagging groceries at Lowes Foods 40 years ago, where he worked his way up to manager of the store. Eventually, he became VP of merchandise at the wholesale grocery distributor MDI in Hickory, N.C., and finally, in 2016, he became president of Piggly Wiggly NC, which is comprised of 38 stores in eastern North Carolina.
So when Messer noticed that one of his stores was underachieving, he hired Smart.Market for Business to create highly personalized customer satisfaction surveys to ferret out the reason for the decline. The result: The surveys delivered via personalized mailers helped Messer collect customer data, gather valuable feedback, address the issues at the flagging store, and increase that store’s revenue.
Getty Images / Cavan Images
Implementing a Customer Satisfaction Survey to Enhance the Customer Experience
In 2018, Messer discovered that one of his stores was lagging behind the rest in terms of sales and decided to survey customers of that store to find out where the weak areas were.
Messer could have quickly and cheaply blasted out an email survey to the store’s customers or installed a pop-up survey on the store’s website. “But we felt our customers would be more inclined to fill out a survey they received in the mail and bring it back for free products, and wouldn’t fill out a survey online,” he says.
Research proves him right: Internet-only surveys can be subject to significant biases, including the fact that rural customers and those over 65 are less likely to use the Internet than urban and younger customers. Because 37% of Piggly Wiggly NC’s customers are both rural and over 65, this is an important consideration. Not only that, but even if a store’s customer base does regularly use the Internet, three-quarters of consumers feel that online surveys interfere with their online experiences.
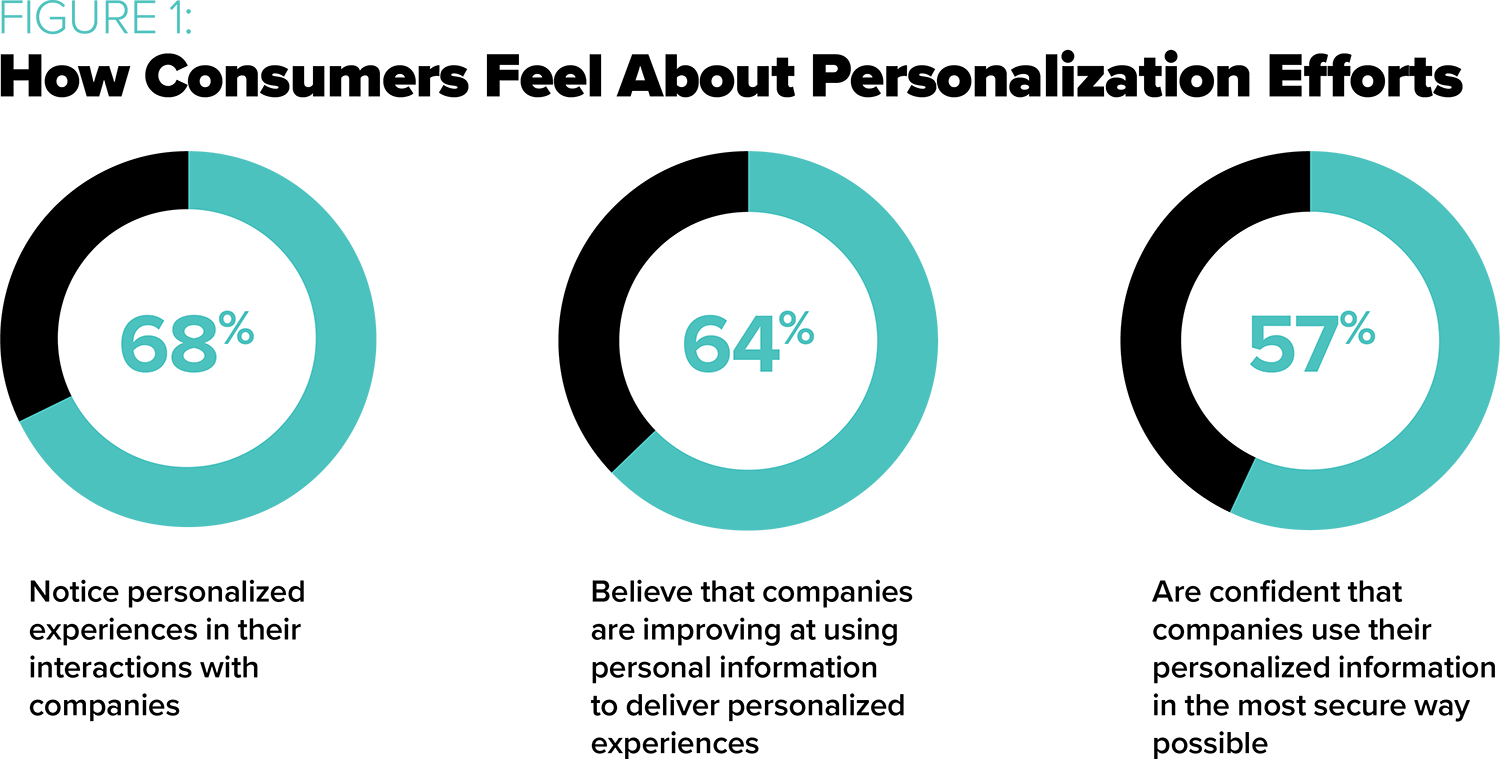
Besides making the decision to invest in print instead of digital surveys, Messer opted to personalize those mailed surveys rather than sending generic mail pieces. In general, personalization positively influences customers: According to a study by Infosys, 86% of respondents who experienced personalization reported that it influences what they buy to some degree, and a quarter said it has a significant influence over their purchasing behavior. Even better, over half of those surveyed said they were “highly in favor” of personalization for grocery promotions.

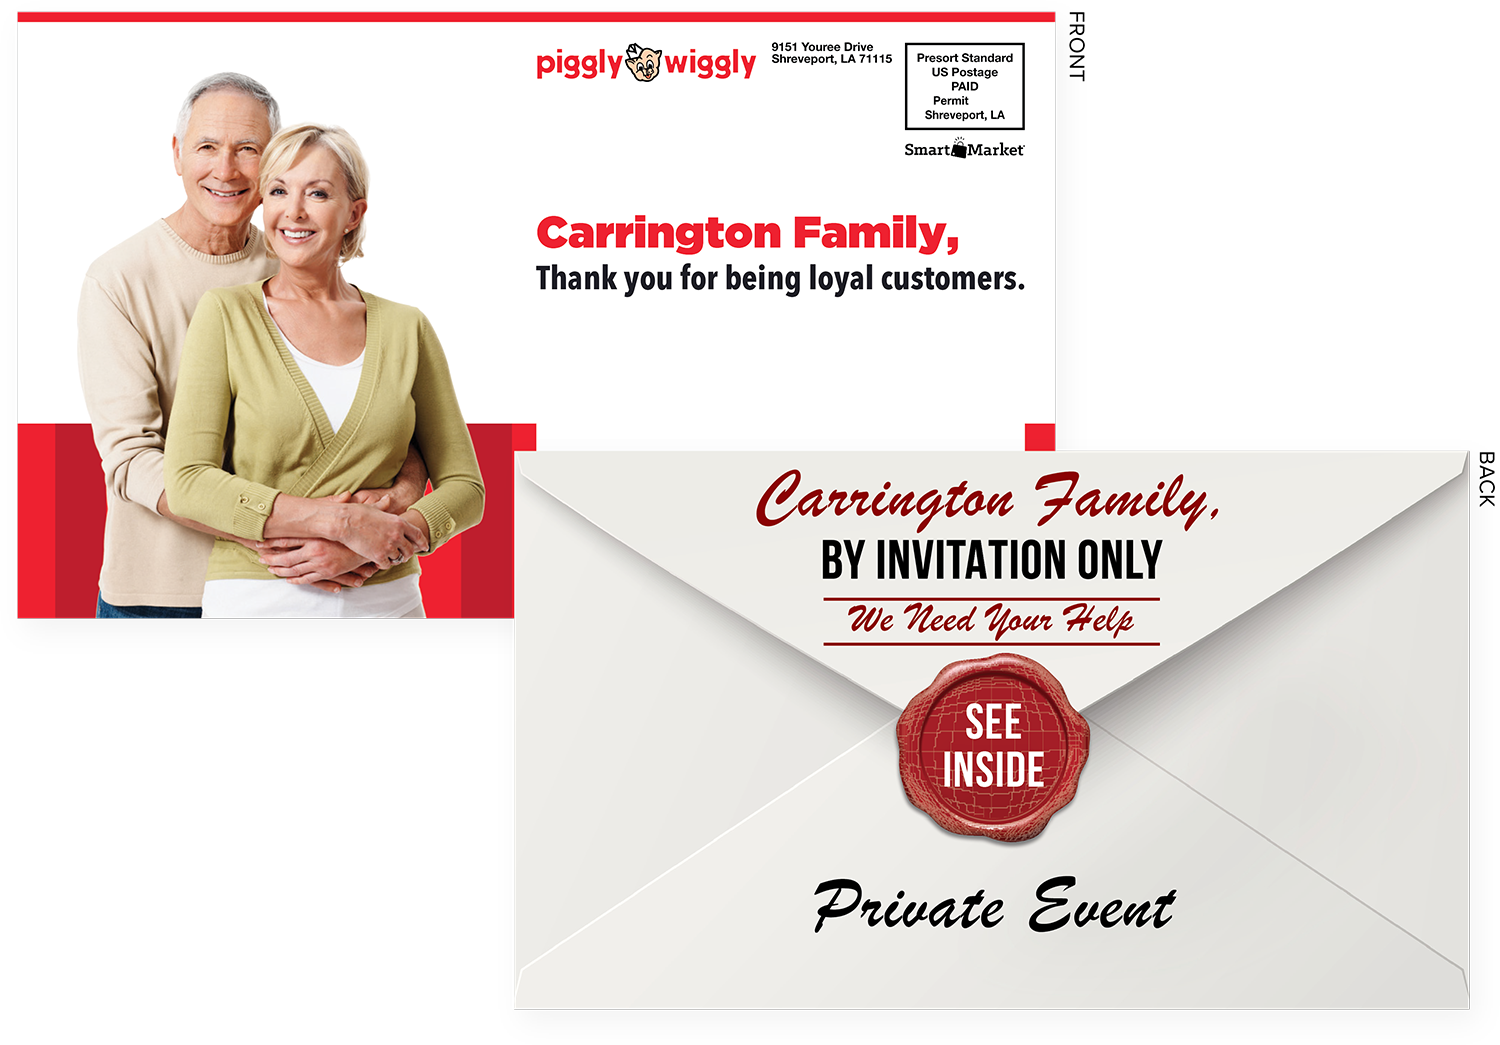
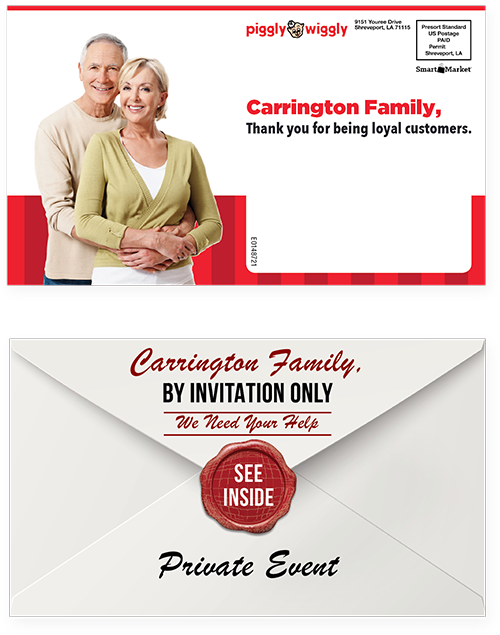
The Piggly Wiggly mail piece was designed to look like an envelope containing an invitation, using 8 ½” x 10” 100# Cover cardstock folded to a 8 ½” x 5” piece. Each side of the piece addressed the family by name, and the photo was swapped out to match the ethnicity, marital status, and age of each customer.
More specifically for this campaign, personalized surveys have been shown to work better than generic ones: In a study on the personalization of mail surveys by the American Statistical Association, the boost in response rate from personalization ranged from 3% to 12%.
Once Messer decided to go with personalized customer satisfaction surveys and mailers, there was the question of what incentive to offer that would entice recipients to fill out the survey. Incentives can increase response rates by 10% to 15%, but finding the right one is key. For example, monetary incentives like coupons, gift cards, and cash are more effective at lifting response rates than nonmonetary incentives, like pens or notebooks.
Messer chose to offer coupons for a 40-ounce bottle of Liquid Tide Simply Detergent and a six-roll pack of Bounty Essentials Paper Towels, each worth about $6 retail. Besides persuading respondents to fill out the survey, these incentives served two other purposes: to get respondents into the store, and to showcase the variety of the store’s offerings. Many shoppers buy laundry and paper products at superstores or warehouse stores, and the coupons served as a reminder that customers can pick up these items while shopping at their local Piggly Wiggly, instead.
“To execute at the same level as the large chains, independents would have to have a vendor for print, a vendor for direct mail, a database to keep up with offers, and a data scientist to summarize the results and provide redemption insights. ... We’re giving the independents the same experience they get from major data science companies, for less than the cost of a postage stamp.”
David Kiehle
SVP and general manager
Smart.Market for Business
Getty Images / Claudia Totir
Variable Data Printing Makes Personalized, Targeted Promotions Attainable
To handle the design, personalization, printing, mailing, and post-survey analysis of the mail piece, Messer partnered with Smart.Market, a patented, data-driven marketing platform firm based in Shreveport, La. The company’s initial focus has been grocery stores, QSR, and Fast Casual, but has since expanded to include furniture, automotive, and financial industries, as well.
Messer had worked with the company in the past and had been impressed with the results. “I would say 99% of the programs we did produced double-digit redemption on the coupons,” says Messer. “We once had a competitor opening nearby and we mailed 8,000 coupons around their area. When they had their grand opening, we never even knew they opened their doors.”
Smart.Market personalizes mail pieces using variable data printing (VDP), a digital printing process that lets the printer pull customer data from a database to personalize the copy and images on each individual piece, all without slowing or stopping the printing process. For example, a single Baby Boomer woman will receive a mail piece with her name called out and a photo representative of her age and sex demographic on the front; whereas, a Hispanic family will receive the same mail piece, but instead personalized with their name and a photo of a Hispanic family.
Smart.Market’s patented technology also offers independent grocery store chains the type of full-scale data collection and analysis that, until now, only the big supermarket chains had the resources to attain. The large chains hire firms that collect and mine customer data, which lets them strategically allocate their marketing dollars by sending promotions to targeted customer segments — and allows them to personalize their offers to increase response rates. Smaller chains, on the other hand, often only have the resources to advertise in newspaper circulars, where they have no control over exactly who receives their offers, no way to personalize promotions, and no cost-effective method to collect customer data from individuals who do respond.

Personalization in marketing is not only noticed, but it is expected by most consumers. Source: Epsilon
David Kiehle, Smart.Market’s SVP and general manager, considers their solution to be a “guerrilla marketing” method of gaining critical mass for smaller chains. “To execute at the same level as the large chains, independents would have to have a vendor for print, a vendor for direct mail, a database to keep up with offers, and a data scientist to summarize the results and provide redemption insights,” says Kiehle.
Smart.Market levels the playing field by using VDP patented technology to print household-specific 2D barcodes on each of the mail pieces, and then employing their software to crunch the data on who is responding. Says Kiehle, “We’re giving the independents the same experience they get from major data science companies, for less than the cost of a postage stamp.”
Smart.Market has statistical evidence that shows response rates improving 20% to 60% from static to variable imaging and messaging, plus the household level targeting allows the advertiser to have the option to send fewer pieces, overall. Most importantly, they now have the response data to use in the preparation and optimization of future campaigns, just like the major chains.
“We have literally had an increase in revenue every week in that store [since launching the campaign, analyzing the survey results, and implementing training.]”
James Messer, president, Piggly Wiggly NC
Getty Images / d3sign
Custom Trade Zones Provide Strategic Customer Data
Smart.Market planned to use the data it got from the 2D barcodes on the Piggly Wiggly coupons to create a Custom Trade Zone (CTZ) for the store.
Many grocers take out ads in their local newspaper circular or participate in shared mail campaigns, where multiple businesses’ promotions are sent together in one package and the advertisers share the direct mail costs. The low cost of these promotions is an advantage, but newspapers and shared mail companies send to zones that are related to their distribution model — zones delineated by ZIP code or by people living X-distance from the advertiser. As Kiehle explains, this forces the grocer to “make the buy” in the newspaper’s or shared mail company’s best interest instead of their own.
“The trade zone is not a perfect circle, yet the go-to move for the shared mail industry and the newspaper industry is to target, say, a three-mile radius around the business,” says Kiehle. Smart.Market, in contrast, starts with the grocer’s “back-of-the-napkin” understanding of their market and hones it by analyzing the data from the unique codes printed on each redeemed coupon. Because the data from each campaign informs the next one, campaigns become more efficient and effective over time.
Smart.Market then plots the customer data on their proprietary software using Google Maps. The resulting amoeba-shaped CTZ may not look as nice as the traditional circular trade zone, but it lets the grocer better target their actual audience.
“The personalization made the customer say, ‘Piggly Wiggly knows who we are ... and they’re asking for our input.’”
Joe Moody
SVP for the Eastern Region,
Smart.Market for Business

Customer Satisfaction Survey Leads to Important Findings — and Big Changes
Joe Moody, SVP for the Eastern Region at Smart.Market, designed the mail piece to look like an envelope containing an invitation, using 8 ½” x 10” 100# Cover cardstock folded to a 8 ½” x 5” piece. Each side addressed the family by name, and the photo was swapped out to match the ethnicity, marital status, and age of each customer.
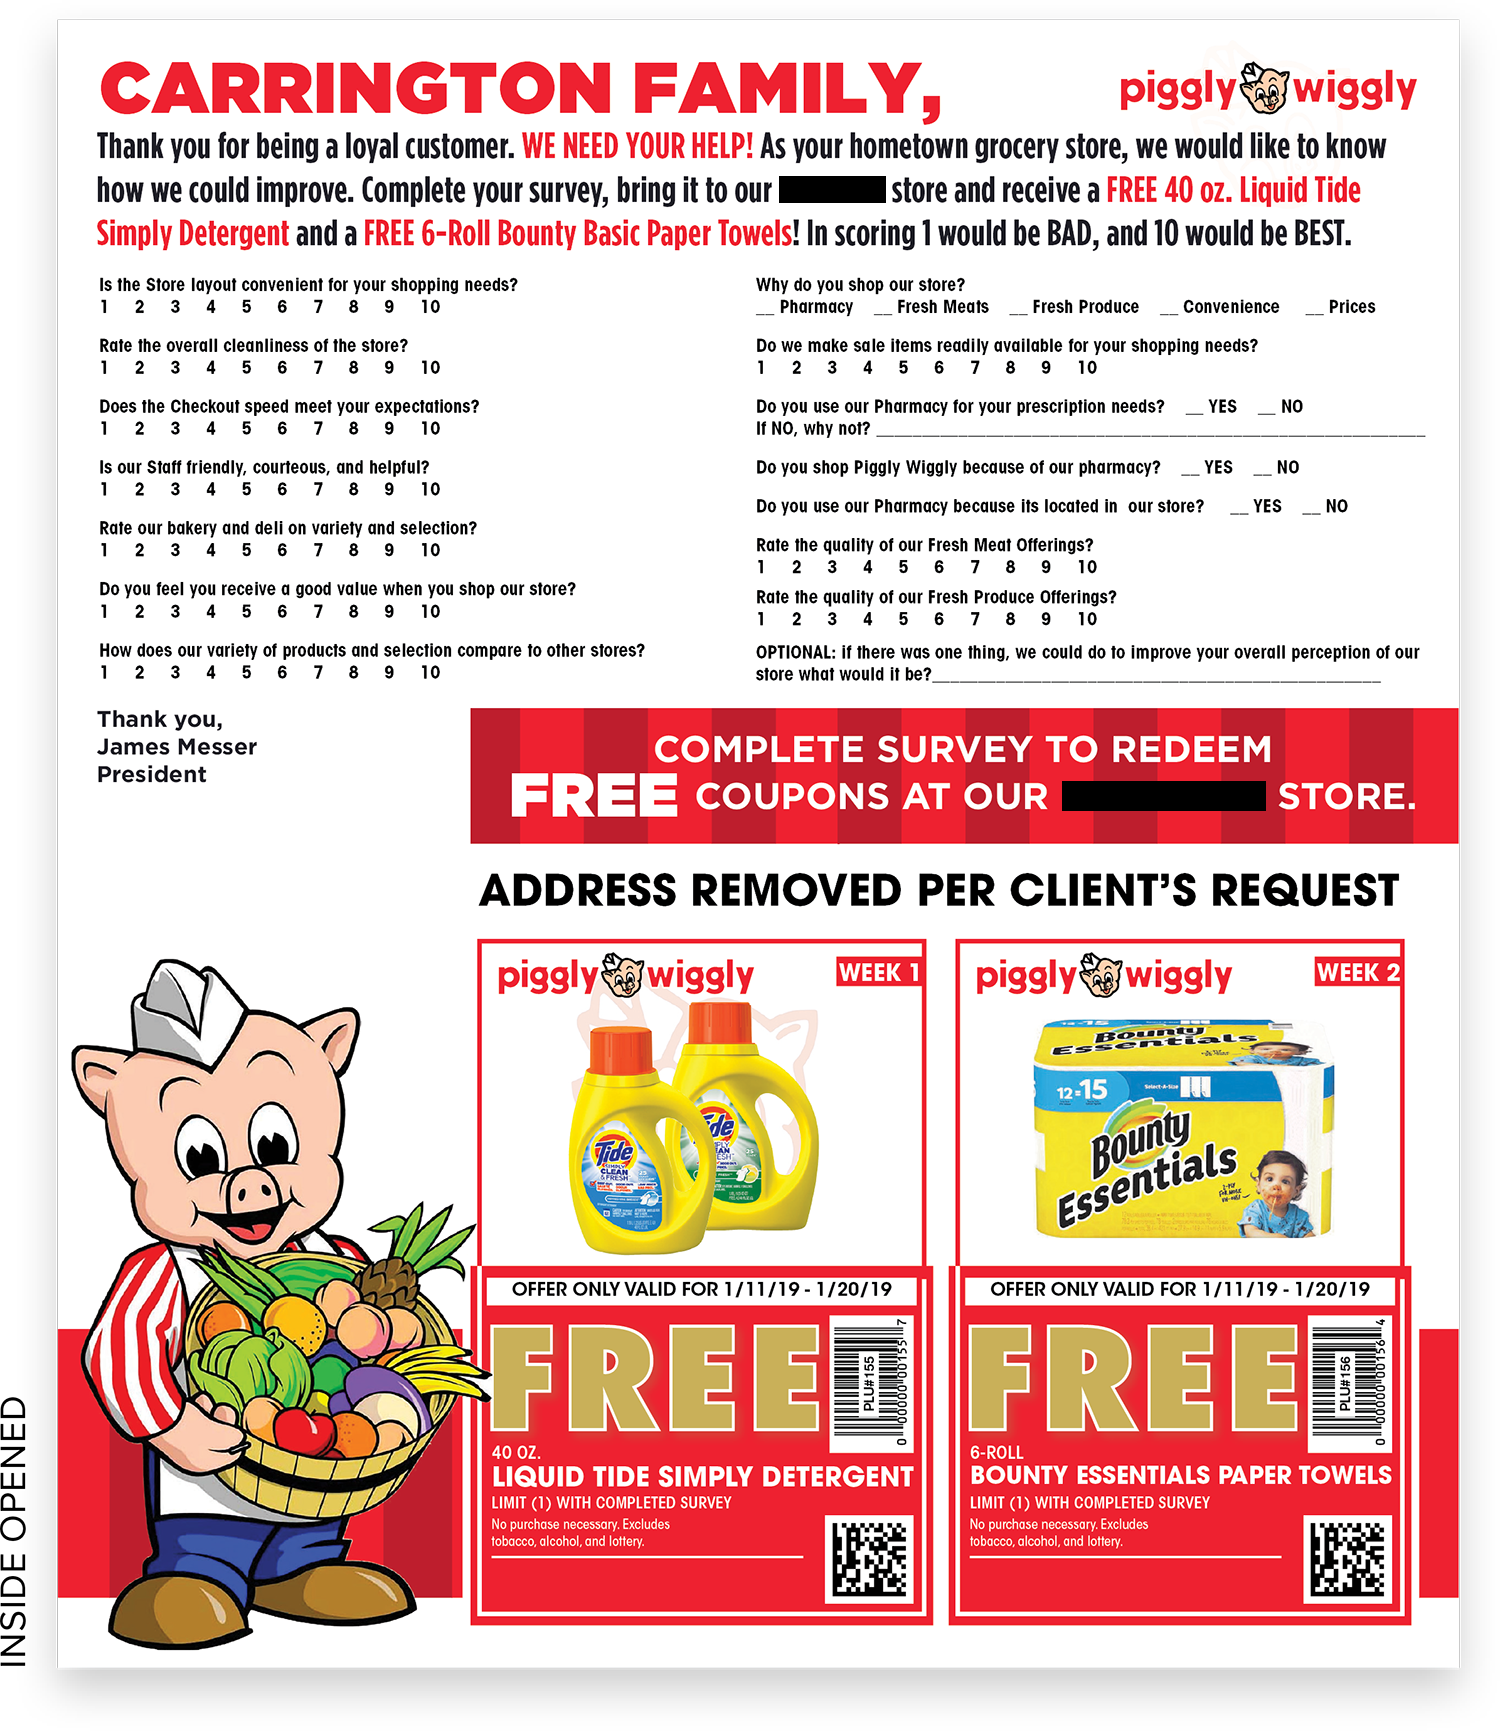
The inside of the mailer contained the survey — which also had the customer’s name — plus the two coupons, each with its unique 2D barcode per household. “The personalization made the customer say, ‘Piggly Wiggly knows who we are ... and they’re asking for our input,’” Moody explains.
Moody wrote up a survey with 15 questions, most of which allowed the customer to rank the store’s product variety and various departments on a 1-10 scale. The coupons that went alongside the survey were valid for 10 days. “Instead of running this campaign for 30 days, we wanted to get an immediate impact so we could get the results back to the store,” says Moody. “The more immediacy there is on a campaign, the quicker you’ll respond, right?”
After making a few small tweaks to the design and survey at Messer’s request, Smart.Market’s print and mail manufacturing arm, Everything Marketing, prepared the pieces. The mailers dropped Jan. 6 to be in homes by Jan. 10, with the coupons being valid from Jan. 11 - 20, 2019.
Just over 11,000 mailers were sent, and 1,464 unique household addresses were captured from the redeemed coupons by Jan. 20, for a unique household redemption rate of over 13%. To redeem the coupons, recipients were required to drop off their completed survey at the checkout, and in the end, the store received 2,915 coupons or a 26.5% redemption rate.
The data reports produced by Smart.Market allowed Messer to view the redemption rate by segment; for example, 18% of Asian seniors redeemed coupons vs. 12% of African-American seniors, 11% of Caucasian seniors, and 8% of Hispanic seniors.


Inside the mailer (see inset image), the recipient would find the personalized survey. The survey included 15 questions, and once it was turned in at the store checkout, the two coupons — each with unique 2D barcodes per household — could be redeemed.
A map by carrier route also showed which areas had the highest and lowest redemption rates. This data also will let Smart.Market build the CTZ for this Piggly Wiggly location, meaning subsequent promotions will be even more targeted, with the ability to find shoppers who look just like the shoppers who redeemed.
As for the customer satisfaction survey results: Most customers said they shopped the Piggly Wiggly store for its fresh meats. The pharmacy was the least-shopped part of the store, offering Messer the opportunity to work on increasing awareness.
When asked what part of the store they’d change, 10% of customers answered “Nothing,” 13% responded “You are great!” and 10% called out the deli-bakery as an area they’d change, offering negative comments about the department’s staff and product variety.
Messer wasn’t surprised by the results; he already had an idea of where the problems lay, and the survey confirmed his suspicions. Once the responses were tallied and he had the results in hand, Messer set up trainings for the deli-bakery staff to improve their customer service and operations. And knowing how important it is to focus on the positive as well as the negative, during a store meeting Messer offered kudos to those departments that got high scores.
The whole purpose of the campaign was to find out why the store was underachieving, fix the problem, and turn the sales numbers around. Since the campaign and the subsequent trainings, says Messer, “We have literally had an increase in revenue every week in that store.” 


